
Diagram 1. Peptide ion formation.
A tandem, or MS/MS, spectrum is made by selecting a narrow mass range from a MALDI spectrum, bombarding the ions into argon atoms so that they fragment, and separating the fragments by spectrometry. The range selected is typically 2~3 Da. Argon is used because it is an inert gas, so that it will not combine chemically with the ions; but has relatively massive atoms, so as to increase its chance of damaging the ions that collide with it.
Thus a tandem mass spectrum shows peaks due to the masses of the various daughter ions produced by this fragmentation. In analysing such a spectrum, we aim to deduce as much as possible about the identities of the daughter ions, and hence of the parent ion. To do this, we must understand the fragmentation process.
The spine of a peptide contains three types of bond, C-C, C-N, and N-C. Any of these may be broken, and the ions resulting from the breakage are named A, B, C, X, Y and Z, as shown in diagram 1. Note the conventional layout of a peptide, with the amino-end at the left.
If we are to observe a fragment ion by tandem mass spectrometry, it is not enough simply to break the parent ion: one of the daughters must acquire a positive charge, so that we are able to detect it. Diagrams 2, 3 and 4 show the mechanisms by which A, B, C, X, Y, and Z ions may become charged.

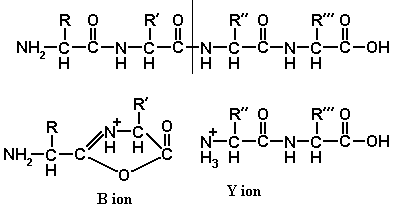
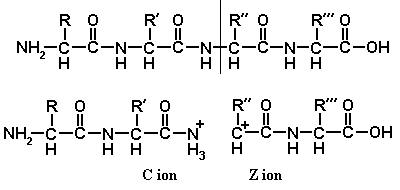
These mechanisms are not all equally plausible. Y ion formation is the most likely to happen, and Y ions are the ones most frequently seen. B ions are also very common. As B ions are ring-shaped, B1 ions are never seen. A ions are also common, but large A ions are rarer than small ones. C and X ions are rarely seen. The existence of Z ions is doubtful.
Other ion types which we may encounter are 'internal' ions, with a fragmentation point at each end; and 'immonium' ions. Their formation is shown in diagrams 5 and 6.


We are also likely to see doubly-charged ions, and possibly ions with more than two positive charges. If an ion with a mass, and hence an M/z ratio, of m acquires a second proton, its mass becomes m+1 and its charge becomes 2, so its M/z ratio becomes (m+1)/2. Acquisition of a third proton would reduce its M/z ratio to (m+2)/3; etc.
| Ion type | Composition | M/z ratio | Frequency |
|---|---|---|---|
| A | Σ +H –CO | S-27 | quite common |
| B | Σ +H | S+1 | common |
| C | Σ +H +NH +H +H | S+18 | rare |
| X | Σ +OH +CO | S+45 | rare |
| Y | Σ +OH +H +H | S+19 | very common |
| Z | Σ +OH –NH | S+21 | very rare |
| doubly-charged parent | parent ion +H+ | (parent M/z + 1) / 2 | very common |
| trebly-charged parent | parent ion +H+ +H+ | (parent M/z + 2) / 3 | rare |
| internal ion | Σ +OH +H +H | S+19 | rare |
| immonium ion | Σ +H -CO | S-27 | rare |
| Table 1. Masses of ions found in tandem spectra. |
| 'Σ' here denotes the total mass of the constituent amino acids, as given in table 2. |
| The Frequency column applies to low-energy collisions in a modern QTOF spectrometer, higher-energy collisions in older spectrometers gave rise to a greater variety of ions. |
The masses of the individual amino acids have been given in the previous chapter, table 4. They are repeated briefly and less accurately, in table 2 below.
| letter | name | mass, Da |
|---|---|---|
| G | glycine | 57.02 |
| A | alanine | 71.04 |
| S | serine | 87.03 |
| P | proline | 97.05 |
| V | valine | 99.07 |
| T | threonine | 101.05 |
| C | cysteine | 103.01 |
| I | isoleucine | 113.08 |
| L | leucine | 113.08 |
| N | asparagine | 114.04 |
| D | aspartic acid | 115.03 |
| Q | glutamine | 128.06 |
| K | lysine | 128.09 |
| E | glutamic acid | 129.04 |
| M | methionine | 131.04 |
| H | histidine | 137.06 |
| F | phenylalanine | 147.07 |
| R | arginine | 156.10 |
| Y | tyrosine | 163.06 |
| W | tryptophan | 186.08 |
| carboxymethyl cysteine | 161.05 | |
| carbamidated cysteine | 160.03 | |
| oxidised methionine | 147.04 |
A numeric subscript indicates the number of amino acids in the ion. Thus B3 or b3 is a B-ion with three amino acids, Y5 or y5 is a Y-ion with five.
A prime ´ indicates a proton acquired in the process of ion formation. Thus C ions were once called C´´ ions, Y ions were called Y´´ ions, etc. One conjectured form of Z ion was called a Zi ion, another with one more proton was called a Z´ ion.
A superscript * indicates an ion that has lost an ammonia molecule, reducing its mass by 17.026549 Da.
A superscript ° indicates an ion that has lost a water molecule, reducing its mass by 18.010565 Da.
Superscript ++ indicates a doubly-charged ion (ions are assumed to have a single positive charge, where not otherwise specified). +++ indicates a trebly-charged ion.
D, E, F, U, V, and W ions are A, B, C, X, Y, and Z ions respectively, but with loss of the side-chain or of part of the side-chain. It is possible to distinguish leucine from isoleucine by high-energy mass spectrometry, as they form different V ions.


The first step is to identify and mark the doubly-charged parent ion, which is present in almost all such spectra, and is the strongest feature of many of them. The M/Z ratio of the parent ion was 1275.67, so the doubly-charged ion should have an M/z ratio of (1275.67 + 1)/2 = 638.33. Indeed, we find that there is an ion with a mass of 638.38, so we can mark this. This ion is of no interest in itself, but by marking it we ensure that we will not later try to identify itself as something else. To see this peak marked, check checkbox 1 under Figure 1.
The second step is to try to identify the strong peaks at the right-hand (high-mass) end of the spectrum, on the assumption that they are Y ions. On this spectrum, there is an obvious choice of where to start – there is a strong peak at 1112.70 and nothing between it and the end of the spectrum. We hope that this ion’s mass is consistent with its being a Yn-1 ion that is, an ion consisting of all but one of the amino acids of the parent ion, the amino-terminal amino acid having been broken off. The parent ion can be regarded as the Yn ion, having a mass of Σ+19. So we subtract the mass of this observed ion from the mass of the parent ion, and obtain 1275.67-1112.70=162.97. We hope that this will be the mass of an amino acid (or possibly the sum of the masses of a small number of amino acids). We find that 162.97 is consistent with the mass of tyrosine (and not with the sum of the masses of any set of more than one amino acids). So we can mark this peak as the Yn-1 ion, and the interval between it, and where the Yn ion would be, as tyrosine, written Y. To see this Y ions marked, check checkbox 2 under Figure 1.
Now we continue to work from right to left, hoping to identify the Yn-2 ion, the Yn-3 ion, etc.
The interval from the 1112.70 peak to the 1055.67 peak is 57.03. This is consistent with glycine.
The interval from the 1055.67 peak to the 1014.52 peak is 41.15. This is not consistent with any amino acid. But the 1014.52 peak is small we can skip it and hope that the next most massive peak works better.
The interval from the 1055.67 peak to the 942.62 peak is 113.05. This is consistent with isoleucine, also with leucine, we cannot tell which.
Continuing in this way (we are fortunate in having a particularly clear spectrum), we can mark in the next two Y ions, with valine and threonine. However it is advisable to stop before we reach the doubly-charged parent ion, as we will encounter other things than Y ions in the left-hand half of the spectrum, and we would like to be able to distinguish these before continuing. To see these Y ions marked, check checkbox 3 under Figure 1.
We now try to deduce what other ions might be present, on the assumption that those we have marked so far are correct. If we find some of these, it will tend to confirm our deductions so far. If we fail to find any of them, it will imply that we are on the wrong track.
If we have identified the five marked Y ions correctly, then the parent ion begins (from its amino terminal) YGIVT (or YGLVT). We may then expect to find the ions listed in table 3. (The B1 ion is not listed here, as B1 ions are not seen.)
| Ion | Sequence | predicted mass |
|---|---|---|
| A1 | Y | 136.08 |
| A2 | YG | 193.10 |
| A3 | YGI | 306.18 |
| A4 | YGIV | 405.25 |
| A5 | YGIVT | 506.30 |
| B2 | YG | 221.09 |
| B3 | YGI | 334.18 |
| B4 | YGIV | 433.25 |
| B5 | YGIVT | 534.29 |
We find that the spectrum does indeed show our conjectured A1, A2, A3, A4, A5, B3, B4, and B5 ions. We mark these on the spectrum. We do not find a B1 ion. To see these A and B ions marked, check checkbox 4 under Figure 1.
We also see some peaks a short distance to the left of some of the peaks we have marked. The peaks at 843, at 942, and at 1055 all have peaks 18 Da to the left of them. These are likely to be due to Y° ions, that is ions which have 'dropped' water. An ion is most likely to drop water if it includes serine or threonine; so we may regard this as evidence that there is a serine or a threonine among the amino acids which follow the YGIVT. We mark these Y° ions on the spectrum. To see these peaks marked, check checkbox 5 under Figure 1.
To the left of the doubly-charged parent ion at 638.38, we see small peaks at 629.33 and at 629.87. These are consistent with other double charged ions, differing from the parent ion by having dropped water (mass 18) and ammonia (mass 17) respectively. This is weak evidence that the parent ion contains both a water-dropping (serine and threonine) and an ammonia-dropping (glutamine, arginine, lysine, and asparagine) amino acid. The latter is not helpful, as we already know that almost all tryptic peptides contain a carboxy-terminal lysine or arginine. However, we mark these ions on the spectrum, so as not to mistake them for something more interesting. To see these doubly-charged ions marked, check checkbox 6 under Figure 1.
The results so far are shown in figure 4.
Now that we have marked as many ions as we can, we are in a position to continue searching for the series of Y ions.
From 742.46, we skip the marked peaks at 638.38, 629.87, and 629.33, and consider the peak at 579.38. The difference, 163.08, is consistent with tyrosine.
From 579.38, we find that the next large unmarked peak is at 508.31, and the difference 71.07 is consistent with alanine.
From 508.31, we find that the next large unmarked peak is at 417.25. The difference 91.06 is not consistent with any amino acid, nor any set of amino acids, so we must reject the peak at 417.25. However there is a peak at about 407, partly obscured by the A4 peak at 405.28. This difference 101 is consistent with threonine.
From 407 we continue, feeling rather less confident than previously, to the next large unmarked peak at 289.17. This difference 118 is again inconsistent with any amino acid or set of amino acids, so we reject that peak. However the next large unmarked peak beyond it, at 244.17, gives a difference 163, consistent with tyrosine.
From 244.17 we find the peak at 147.18, giving a difference of 94.99, consistent with proline. This restores our confidence.
The peak at 147.13 is consistent with a lysine Y1 ion. We have thus completed a Y-ion walk from one end of the spectrum to the other. This is an excellent result.
(Almost every tryptic peptide has a lysine or an arginine at its carboxy-terminal end, and therefore gives rise, usually, to Y1 ions. Their masses are 175.1195 for arginine and 147.1134 for lysine.)
We now know the complete sequence of the parent ion, YGIVTYATYPK. This has 10 amino acids, so as well as marking the smaller Y ions on the spectrum, we can relabel the large ones with numeric subscripts in place of n-1 etc. To see the complete Y ion sequence marked, check checkbox 6 under Figure 1.
Note that there is a large unexplained peak at 289.17. This is not unusual. Indeed, it is unusual to have so few unexplained peaks.
As before, we start at the high-mass end. The interval from the small peak at 1272.74 to the parent ion at 1384.71 is 101.97 Da, not consistent with any amino acid or set of amino acids. Therefore we ignore this and move on to the next peak, at 1200.71. The interval from this to the parent ion is 184.00 Da. This is not consistent with any single amino acid, but is consistent with any of four pairs of amino acids: A+I, I+A, S+P, and P+S. Leaving aside for the moment the question of which of these pairs it might be, we move on.
As in the previous example, we can now walk down the series of Y ions as far as the doubly-charged parent ion, finding good matches. We now believe that the amino acid sequence of this peptide reads ??DLNSA..... We believe that the ?? is one of AI, IA, SP, or PS, and we would like to know which.
One way to do this is to look for a small peak, representing a Y ion with a mass between 1200 and 1384. As there are only four possibilites, we can calculate where to look. Adding the masses of A, S, P, and I respectively to 1200.71, we get 1271.75, 1287.74, 1297.76, and 1313.79. We search the spectrum for a tiny peak at any of these masses. Unfortunately, with this spectrum this yields nothing.
Another method is to look for an A1 ion corresponding to one of these bases (or a B1 ion would do, except that B1 ions are not found). For A, S, P, and I respectively an A1 ion would have a mass of 44.05, 60.04, 70.07 or 86.10 Da. When we look at the extreme low mass end of the spectrum, we find only one such peak, at 86.12 Da. We can therefore be fairly confident that the first amino acid in this peptide is isoleucine (or, of course, leucine) and that the second one is therefore alanine.
It is worth noting that isoleucine and alanine are both 'aliphatic' – that is, their side chains are simple hydrocarbon chains, with nothing reactive in them. We often find that peptide chains are disinclined to break between two such amino acids. The unreactive amino acids are glycine, alanine, valine, isoleucine, and leucine. On this basis, we might have been inclined to suspect that the missing Y ion in this spectrum was due to failure to break an AI, rather than an SP, bond.


One approach is to try to get the program to interpret a spectrum, much as we have done manually above. An important principle of such a program is that one peak can tell us very little; but two or more peaks, with some known or conjectured relationship between them, can provide compelling evidence. Some examples of relationships between pairs of peaks are:
Another approach relies entirely on computer power, rather than on semblance of intelligence. If we have a library which we are searching, then we can take every candidate peptide, perform a simulated tandem on it, and compare the resulting simulated spectrum with our observed one, scoring for peaks in the same places. The library may be a protein library as described in the previous chapter. Or, if the parent ion is not too large and its mass is known with enough accuracy, it can be a 'synthetic' library, like the one listed in the previous chapter, table 5.
This approach is the one used by the program 'SEQUEST'. SEQUEST was developed by Jimmy Eng and John Yates at the University of Washington, and is described at http://fields.scripps.edu/sequest/. To run it, you specify
Suppose we have a MALDI mass of 1784.91 ± 0.01 Da. This is in itself insufficient to identify a unique protein from a library. We then apply tandem analysis to this peptide, and get a spectrum with rather few peaks, but with peaks at 1030.5, 1159.5, 1306.5, and 1420.6 Da, all ± 0.2 Da. It is likely that these peaks are Y ions; and while we cannot hope to identify them, we can be fairly confident that their mass differences are caused by the internal sequence ..NFE.. in the peptide.
We now think that the structure of our peptide is [364.1±0.1]NFE[1011.6±0.1]. Here [N] means a subsequence of amino acids whose masses (as listed in table 2 above) sum to N. We can combine this information with the more accurate MALDI mass of 1784.91 ± 0.01 Da, and do a computer search using all this information. This search is likely to yield a set of results small enough to be useful.
| Main peptide MS page. |
Copyright N.S.Wedd 2003, 2004. Last updated 2007-07-11. |